Submitted by nfitzkee on
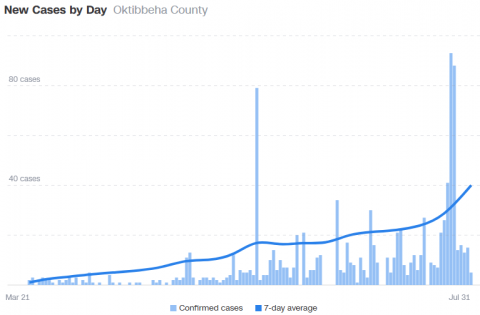
Something to think about for your Sunday - how much do we trust data presented to us in graphical form? I've been looking at the CNN county numbers for COVID-19 cases for several months. It's very helpful, since MSDH doesn't track new daily cases as part of its website (just total cases per county each day). The CNN page also includes the "7-day average," which is helpful, since test results come in at an inconsistent rate.
Looking at a recent graph (above), I noticed that the 7-day average actually had a lot of odd features. For one, it seems to always be larger than the number of points, even when those daily cases are quite small. For example, in April, the curve is far larger than the new daily cases. For another, even though the past several days have seen smaller numbers of cases, the 7-day average continues to climb. Any college student knows that receiving grades lower than their exam average will tend to make the average go down, not up, even if only by a small amount.
One of my friends from high school, Tim Ehlenbeck, agreed, and he was gracious enough to calculate the 7-day average. Sure enough the result is quite different from what's on CNN's site:
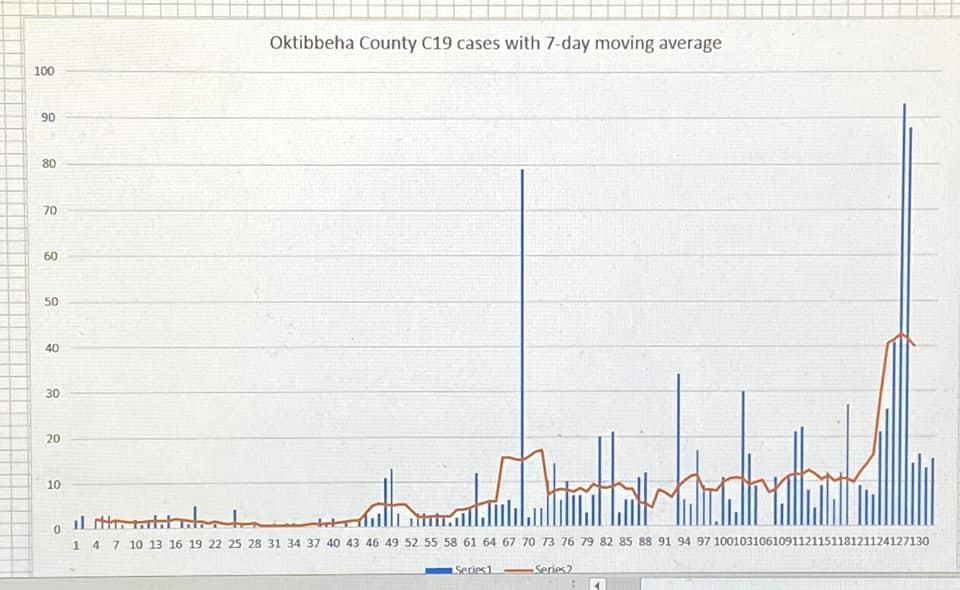
The graph above uses the three days before and three days after to create an moving average window, which performs much more closely to expectations. An alternative would be to calculate the average over the past seven days, but even this doesn't explain CNN's data. This trend seems to hold up for multiple counties in our region: the CNN-calculated 7-day average doesn't appear to match the actual daily case average.
What's important here is not that we know something that CNN doesn't know (although I hope they will fix it!), but rather this: I stared at a graph like this literally for months before I realized that something was wrong. For a while, one of my daily rituals was googling "CNN COVID zip" to monitor how our county was doing.
This has implications for how we do our science: It's very easy to look at graphical data and say "yup, that looks good," especially when the data agrees with our implicit biases. Of course it makse sense that the average is increasing, because the pandemic is getting worse, right? Except in this case, that's not what is happening, at least with the current testing numbers.
May this be a reminder that we should always be thinking about our data. Whether that data relates to COVID cases or molecular properties, we cannot afford to be complacent!